Analytics
Analytics
The Analytics screen is a read-only insights dashboard. Everything is derived from your journal — no separate data to maintain.
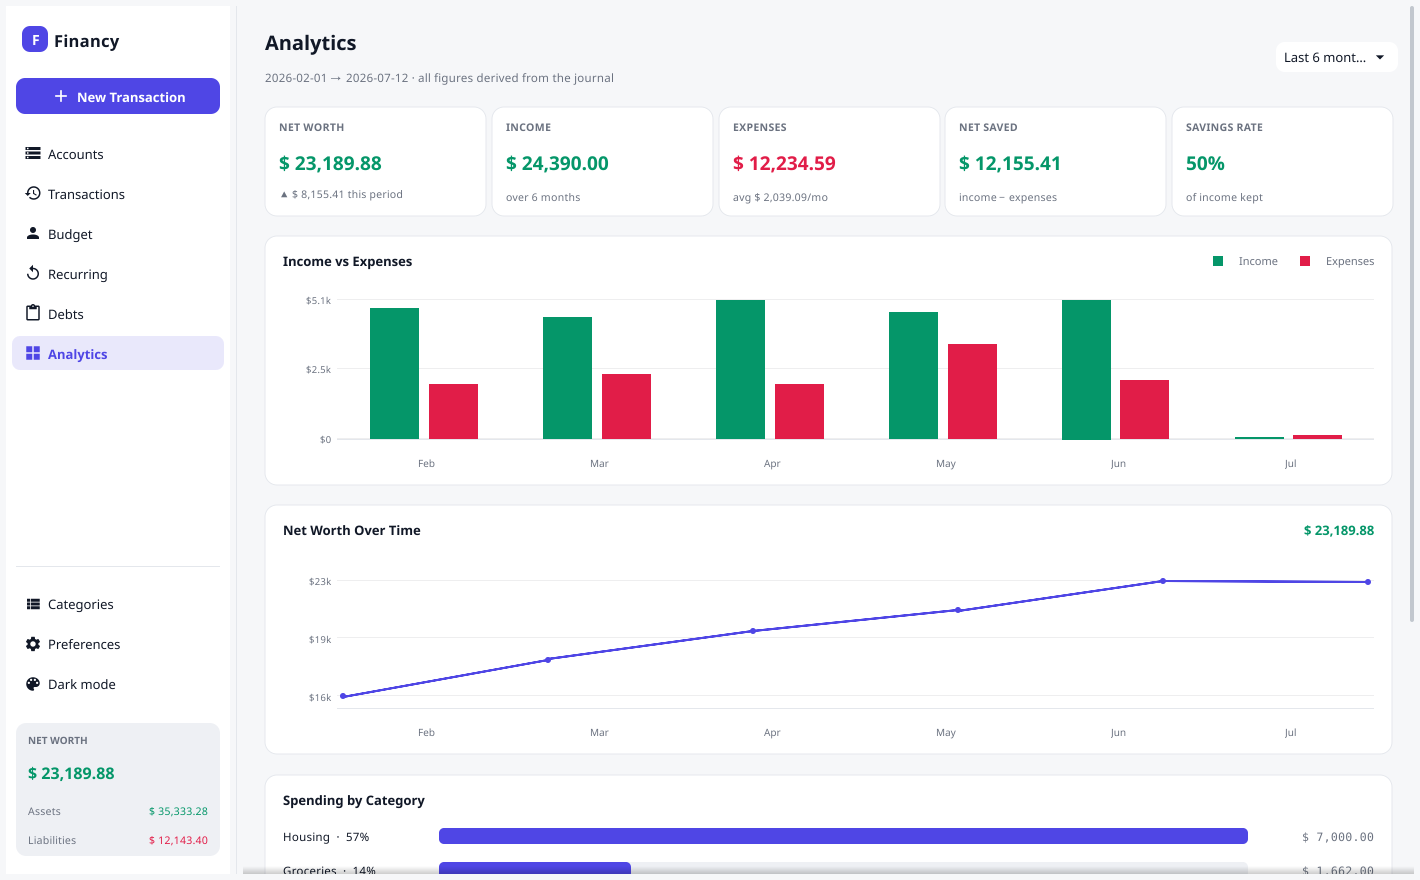
Period selector
Pick the reporting window at the top: This month, Last 3 / 6 / 12 months, or Year to date. Every figure and chart updates to match.
KPI cards
- Net Worth — current, with the change over the period.
- Income and Expenses — totals for the period (plus average monthly spend).
- Net Saved — income minus expenses.
- Savings Rate — the share of income you kept.
Charts
- Income vs Expenses — grouped monthly bars.
- Net Worth Over Time — a running trend line.
- Spending by Category — ranked bars with each category’s share.
Charts are drawn natively (no web dependencies), with value gridlines and hover tooltips showing the exact figures for any month.
Because analytics is derived, it’s always consistent with the journal — fix a
transaction and the dashboard updates instantly.